PMarket Arena: A Live Laboratory for Prediction Markets
A concise project note on PMarket Arena, a browser-based simulation workbench for studying trader behavior, shocks, liquidity stress, and market convergence.
Chuan August Sun · Institute of Lucidity
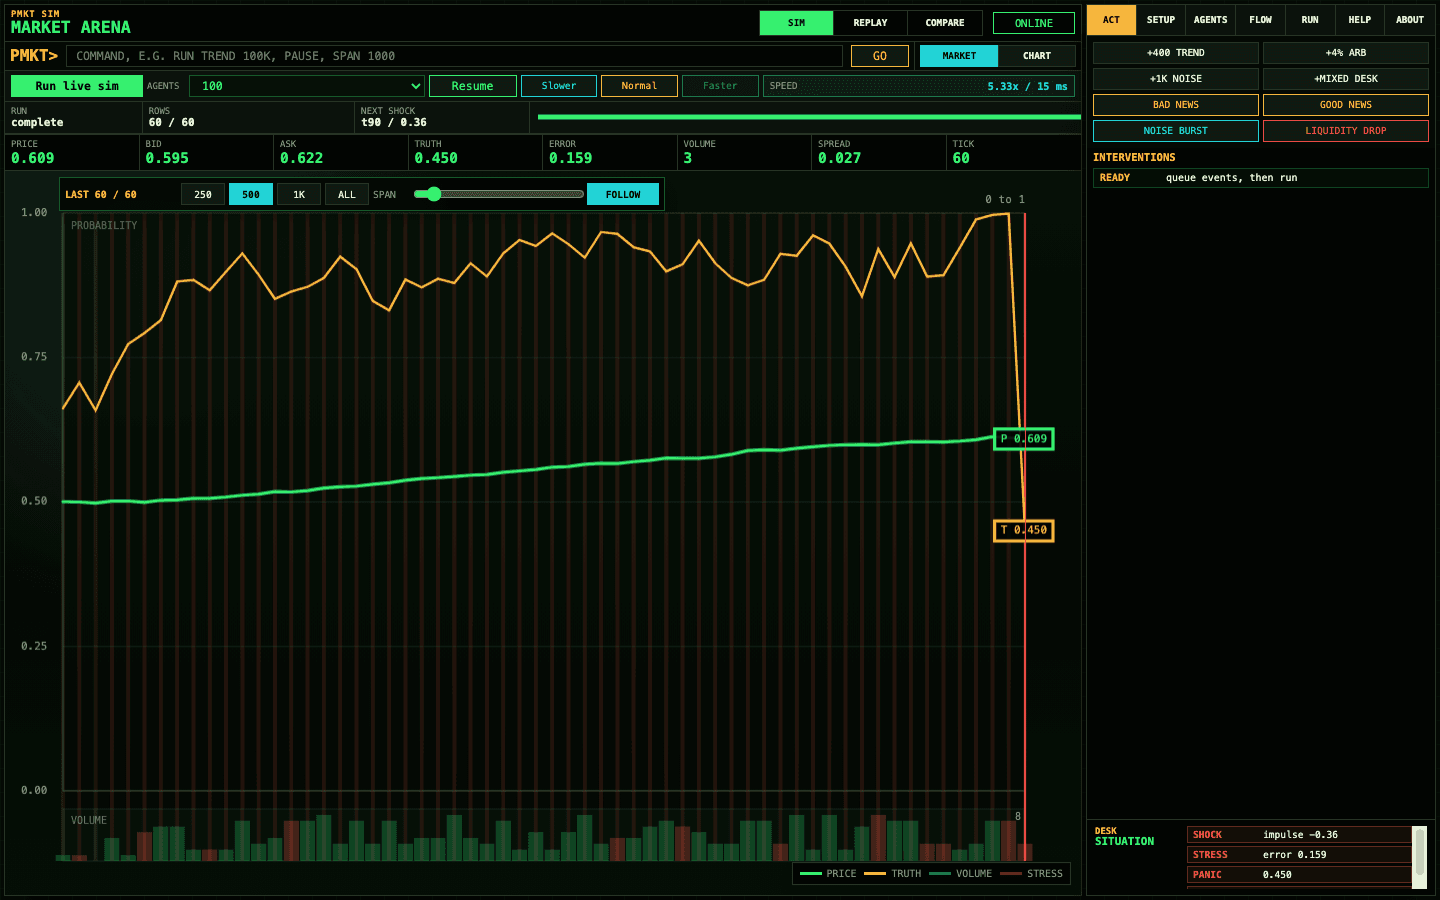
I built PMarket Arena to make prediction market mechanics visible. A market price is not just a number. It is the trace of belief, liquidity, pressure, reflexivity, and institutional capacity moving under uncertainty.
Most prediction market demos show a clean probability chart. That is useful, but it hides the parts I care about most: who is trading, why they are trading, whether the price is tracking the latent truth, how quickly arbitrage responds, and what happens when the market becomes crowded with one kind of behavior.
PMarket Arena is a browser-based simulation workbench for that problem. It lets me run a synthetic market, change the trader population, inject shocks, watch price and truth move tick by tick, and inspect the pressure behind the movement.
How to Read This Project
PMarket Arena is best read as a research program with three public surfaces. The paper asks the formal question. The arena makes the mechanism visible. The Fieldworks notes explain the connection in plain technical language.
| Surface | What it does | How to trust it |
|---|---|---|
| Paper and research briefs | State the claim, method, result, and boundary | Look for reproducible runs, metrics, and explicit limits |
| PMarket Arena | Lets the reader intervene in a live synthetic market | Treat it as a mechanism lab, not as live venue evidence |
| Fieldworks articles | Translate the research into inspectable public reasoning | Follow the series path and compare each post to the artifact it references |
The Core Equation
The arena starts from a simple claim: the visible price is an output of a population system.
That equation is not a full exchange model. It is the organizing lens. To understand the price, I need to inspect the forces producing it.
What PMarket Arena Does
The arena treats a prediction market as an ecology of trader cohorts rather than one clean probability process. Rational traders, trend followers, panic traders, arbitrageurs, and noise traders all create different kinds of pressure. The market price is what happens after those pressures pass through liquidity, price impact, inventory, spread, and shock response.
During a run, I can inspect:
- price versus latent truth
- volume, spread, and order-flow intensity
- activity by trader cohort
- cohort risk, PnL, and capital stress
- liquidity stress, funding stress, and slippage
- interventions, shocks, and event history
- rule-based market commentary grounded in the current tick
Interventions
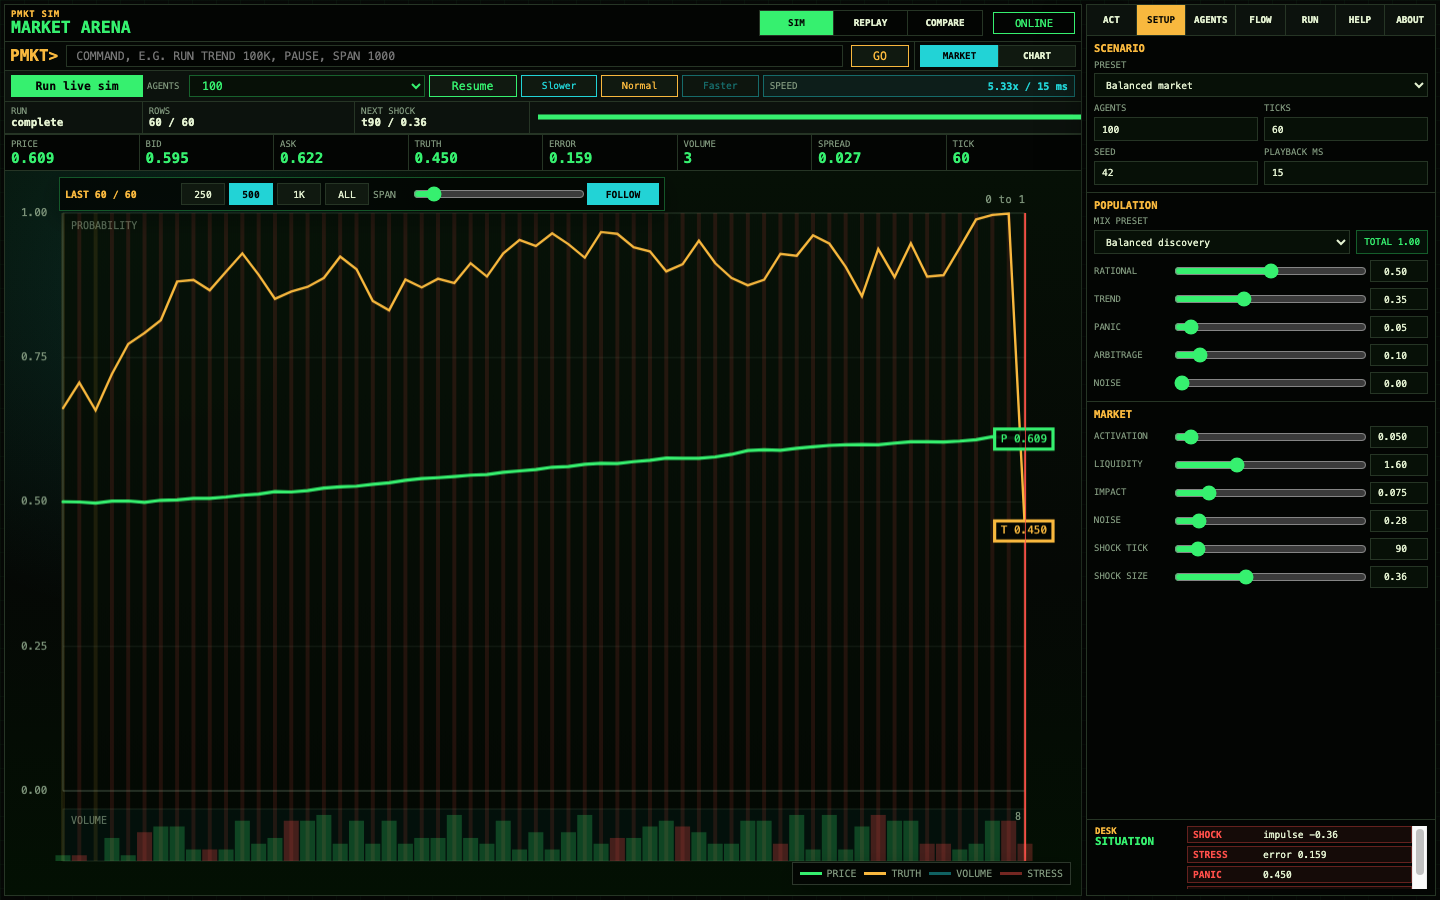
The most important feature is intervention. A static simulation is useful, but an interactive arena lets me ask causal questions quickly.
For example, I can add trend followers, inject a bad-news shock, lower liquidity, or add arbitrage capacity. The interface records the intervention and shows how price, volume, spread, stress, and cohort pressure respond.
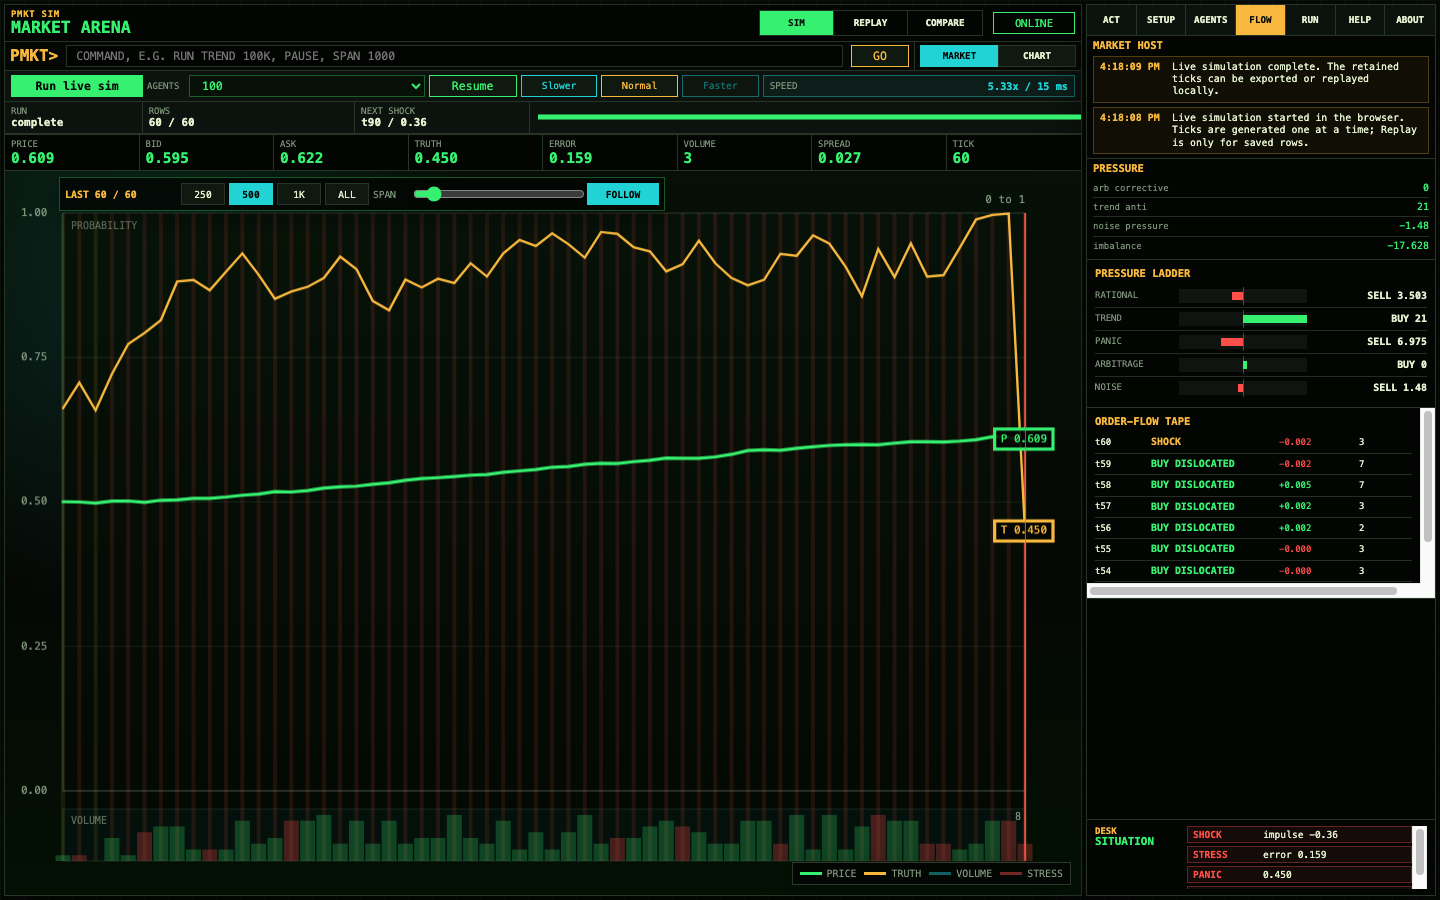
This is the main reason the arena exists. It turns abstract market structure questions into something inspectable: when does price track truth, when does it drift, and when does liquidity or crowding make the signal fragile?
Architecture
The public version is intentionally stateless. Live simulations run in the browser. Serverless APIs return bounded simulation results and static replay/scenario data. Browser-created scenarios and replays are downloaded by the user instead of being written to the deployment filesystem.
interactive_simulation/
  public/
    index.html
    app.js
    simulation-engine.js
    styles.css
  server.js
  vercel-handler.js
  api/
  scenarios/
  replays/
  scripts/
That boundary keeps the app deployable on normal Vercel hosting and avoids long-running server-held sessions. If persistent collaborative sessions become useful later, they can be added as a separate layer.
Evidence Boundary
The arena is not the paper evidence engine. It is a fast, visual, cohort-level approximation built to demonstrate mechanisms: composition effects, trend pressure, panic flow, liquidity stress, arbitrage correction, and shock response.
For formal claims, I use a separate Python research workflow. The browser arena is an explanation and intuition layer. That split matters: the formal experiment layer protects rigor, and the arena makes the dynamics easier to inspect.
| Layer | Role | Claim Status |
|---|---|---|
| Python research pipeline | Multi-seed experiments, logs, metrics, figures | Formal paper evidence |
| Node/browser arena | Interactive scenarios and visual interventions | Mechanism demonstration |
| Fieldworks articles | Public explanation and research narrative | Interpretation layer |
How I Use It
- Start with a balanced market and fixed seed.
- Run the market long enough to see normal tracking behavior.
- Add one intervention, such as trend followers, arbitrage capacity, a liquidity drop, or a news shock.
- Watch price, truth, volume, spread, and commentary.
- Export the replay or translate the observation into a more rigorous experiment.
Where It Goes Next
The next step is to make the arena a better bridge between research, product design, and public explanation: better scenario libraries, richer replay comparison, clearer calibration badges, and more experiments beyond prediction markets.
Open the arena here: https://arena.iolucidity.org/